Zip codes, those humble 5 digits that help get mail to your front door can also unlock a treasure box of data about the people who live there. We’re going to show you how, and it’s going to blow your mind.
You’ve likely heard the term demographics – data points like age, sex, race, and income. You may have heard the term psychographics – attitudes, aspirations and psychological criteria humans use in making purchase decisions. When you mix these two data sets together, you get a really powerful view of a customer.
Dance studios rely on hyper-local marketing, and rightly so, because families lead incredibly busy lives and travel time and convenience are critically important factors in choosing activities for their littles. Enter the humble zip code.
Meet Tapestry: A FREE Tool To Explore Demographics & Psychographics By Zip Code

Let’s Explore The Tool
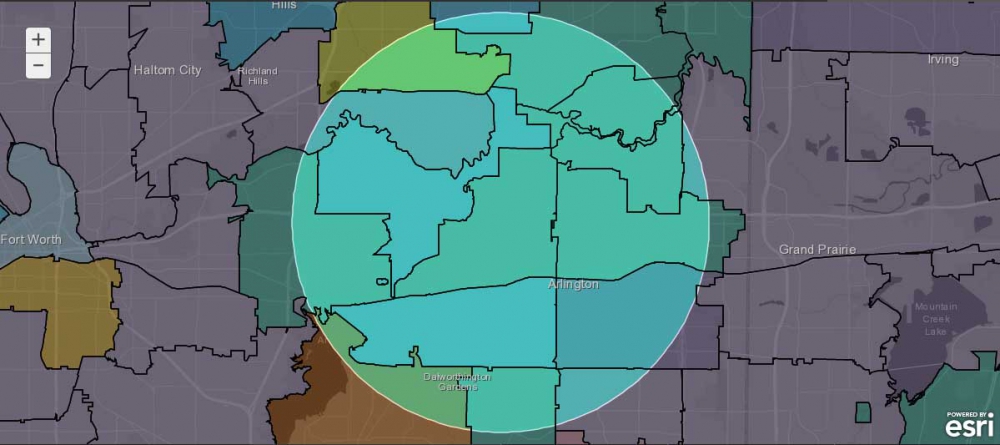
Once you enter your zip code, you’ll get a color coded map with hover overlays that indicate what the primary profile for that area is. Here is an example of area code 76012:

When you click the label name, the box on the lower left of the screen changes to give a description of the Tapestry Segment. It’s a tiny box, and not the easiest thing to read, but it has a REALLY important link inside it that says “Click For More Details”. (See the yellow circled item below). When you click that, you’ll get a detailed PDF report that you can save!

The segment box shows the top 3 segments for your zip code, so be sure to explore all of them. In the example shown here, the segments are Young and Restless, Metro Fusion and NeWest Residents
To the right of the segment description box are some other data highlights:


What You’ll Discover In The PDF
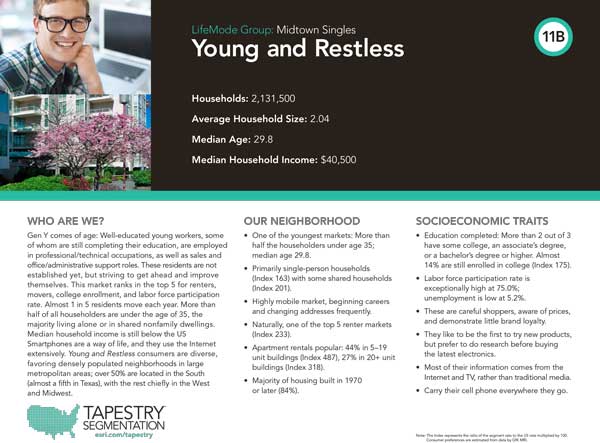
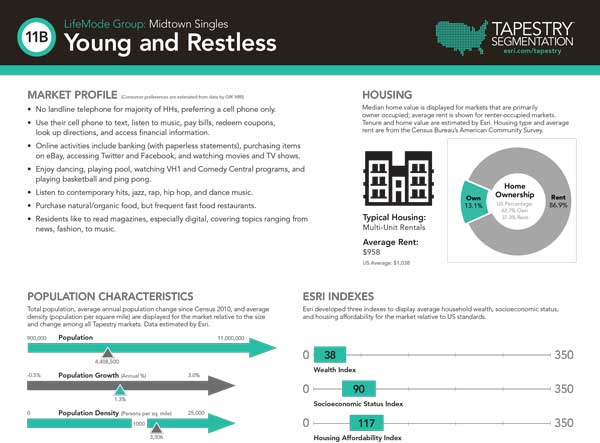
- A short narrative on the segment, describing how they live, shop, work and behave.
- Neighborhood details
- Socioeconomic traits
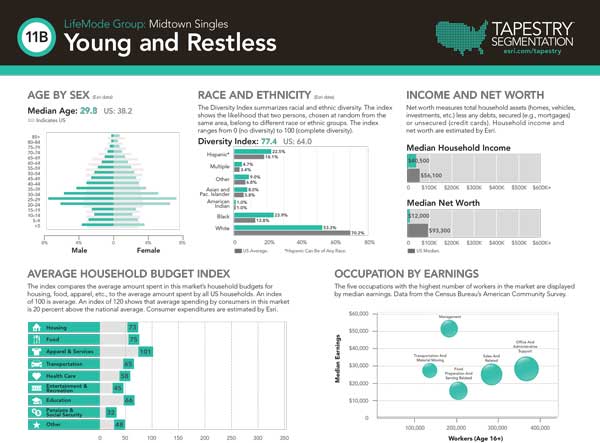
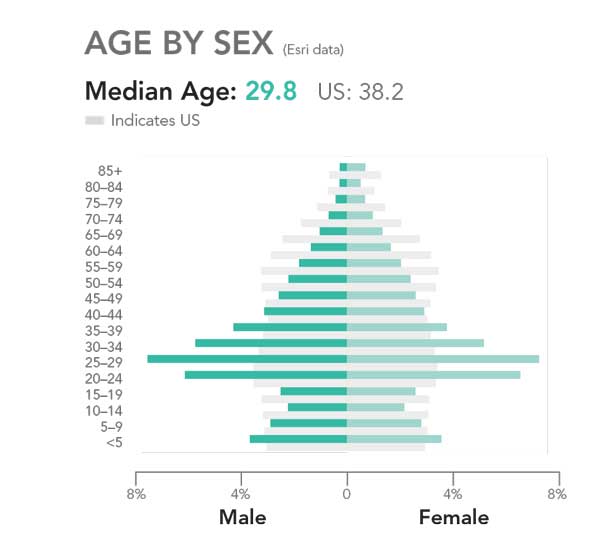
- Age breakdowns – be SURE to check that chart out because it shows you ages of kids in these segments which is NOT typically available in other data sets
- Income views – by top occupations in the segment and by household
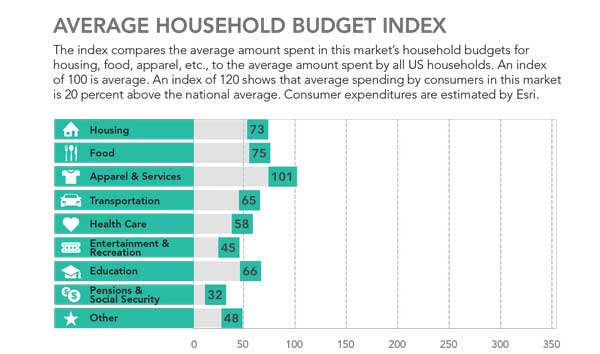
- Household Budget Index – a breakdown of how households are allocating their spending
- Market profile – consumer preferences
- Housing details – renters vs owners
- And much more
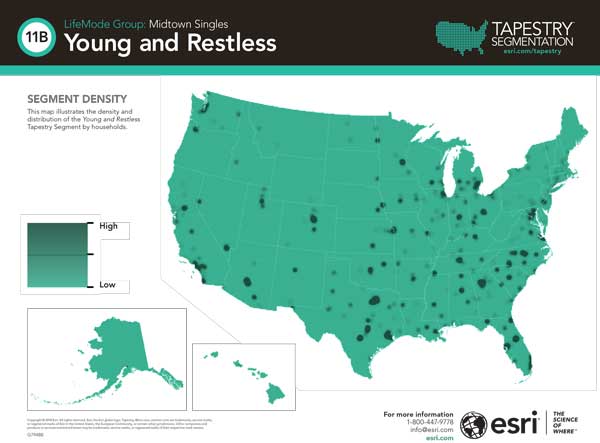
Here are some snapshots of the report for 76012
Ok dance marketer – it’s your turn. Head on over to ESRI’s Tapestry Tool and type in your zip code!